Financial research note
How higher mortgage quote rates change repayments
Bottom line
A one percentage point rise in the quoted annual rate adds about £144 to £201 to the weighted mean monthly repayment across nine assumptions for England and Wales. These are illustrative new repayment quotes built from FCA product sale bands for 2025 Q4.
These are synthetic repayment quotes built from the FCA quarterly main analysis of regulated mortgage product sales for the ten published postcode regions covering England and Wales. The selected tables exclude internal product transfers and further advances. The source counts products rather than unique households, and the calculation treats each synthetic state as a hypothetical repayment loan.
For hypothetical new repayment quotes, the weighted mean monthly increase ranges from £213.74 to £395.87 in London and £97.16 to £110.33 in the North East across the separate branches. The constructed London samples have higher loan medians. For a fixed term and starting rate, a larger assumed loan turns the same rate rise into a larger cash increase.
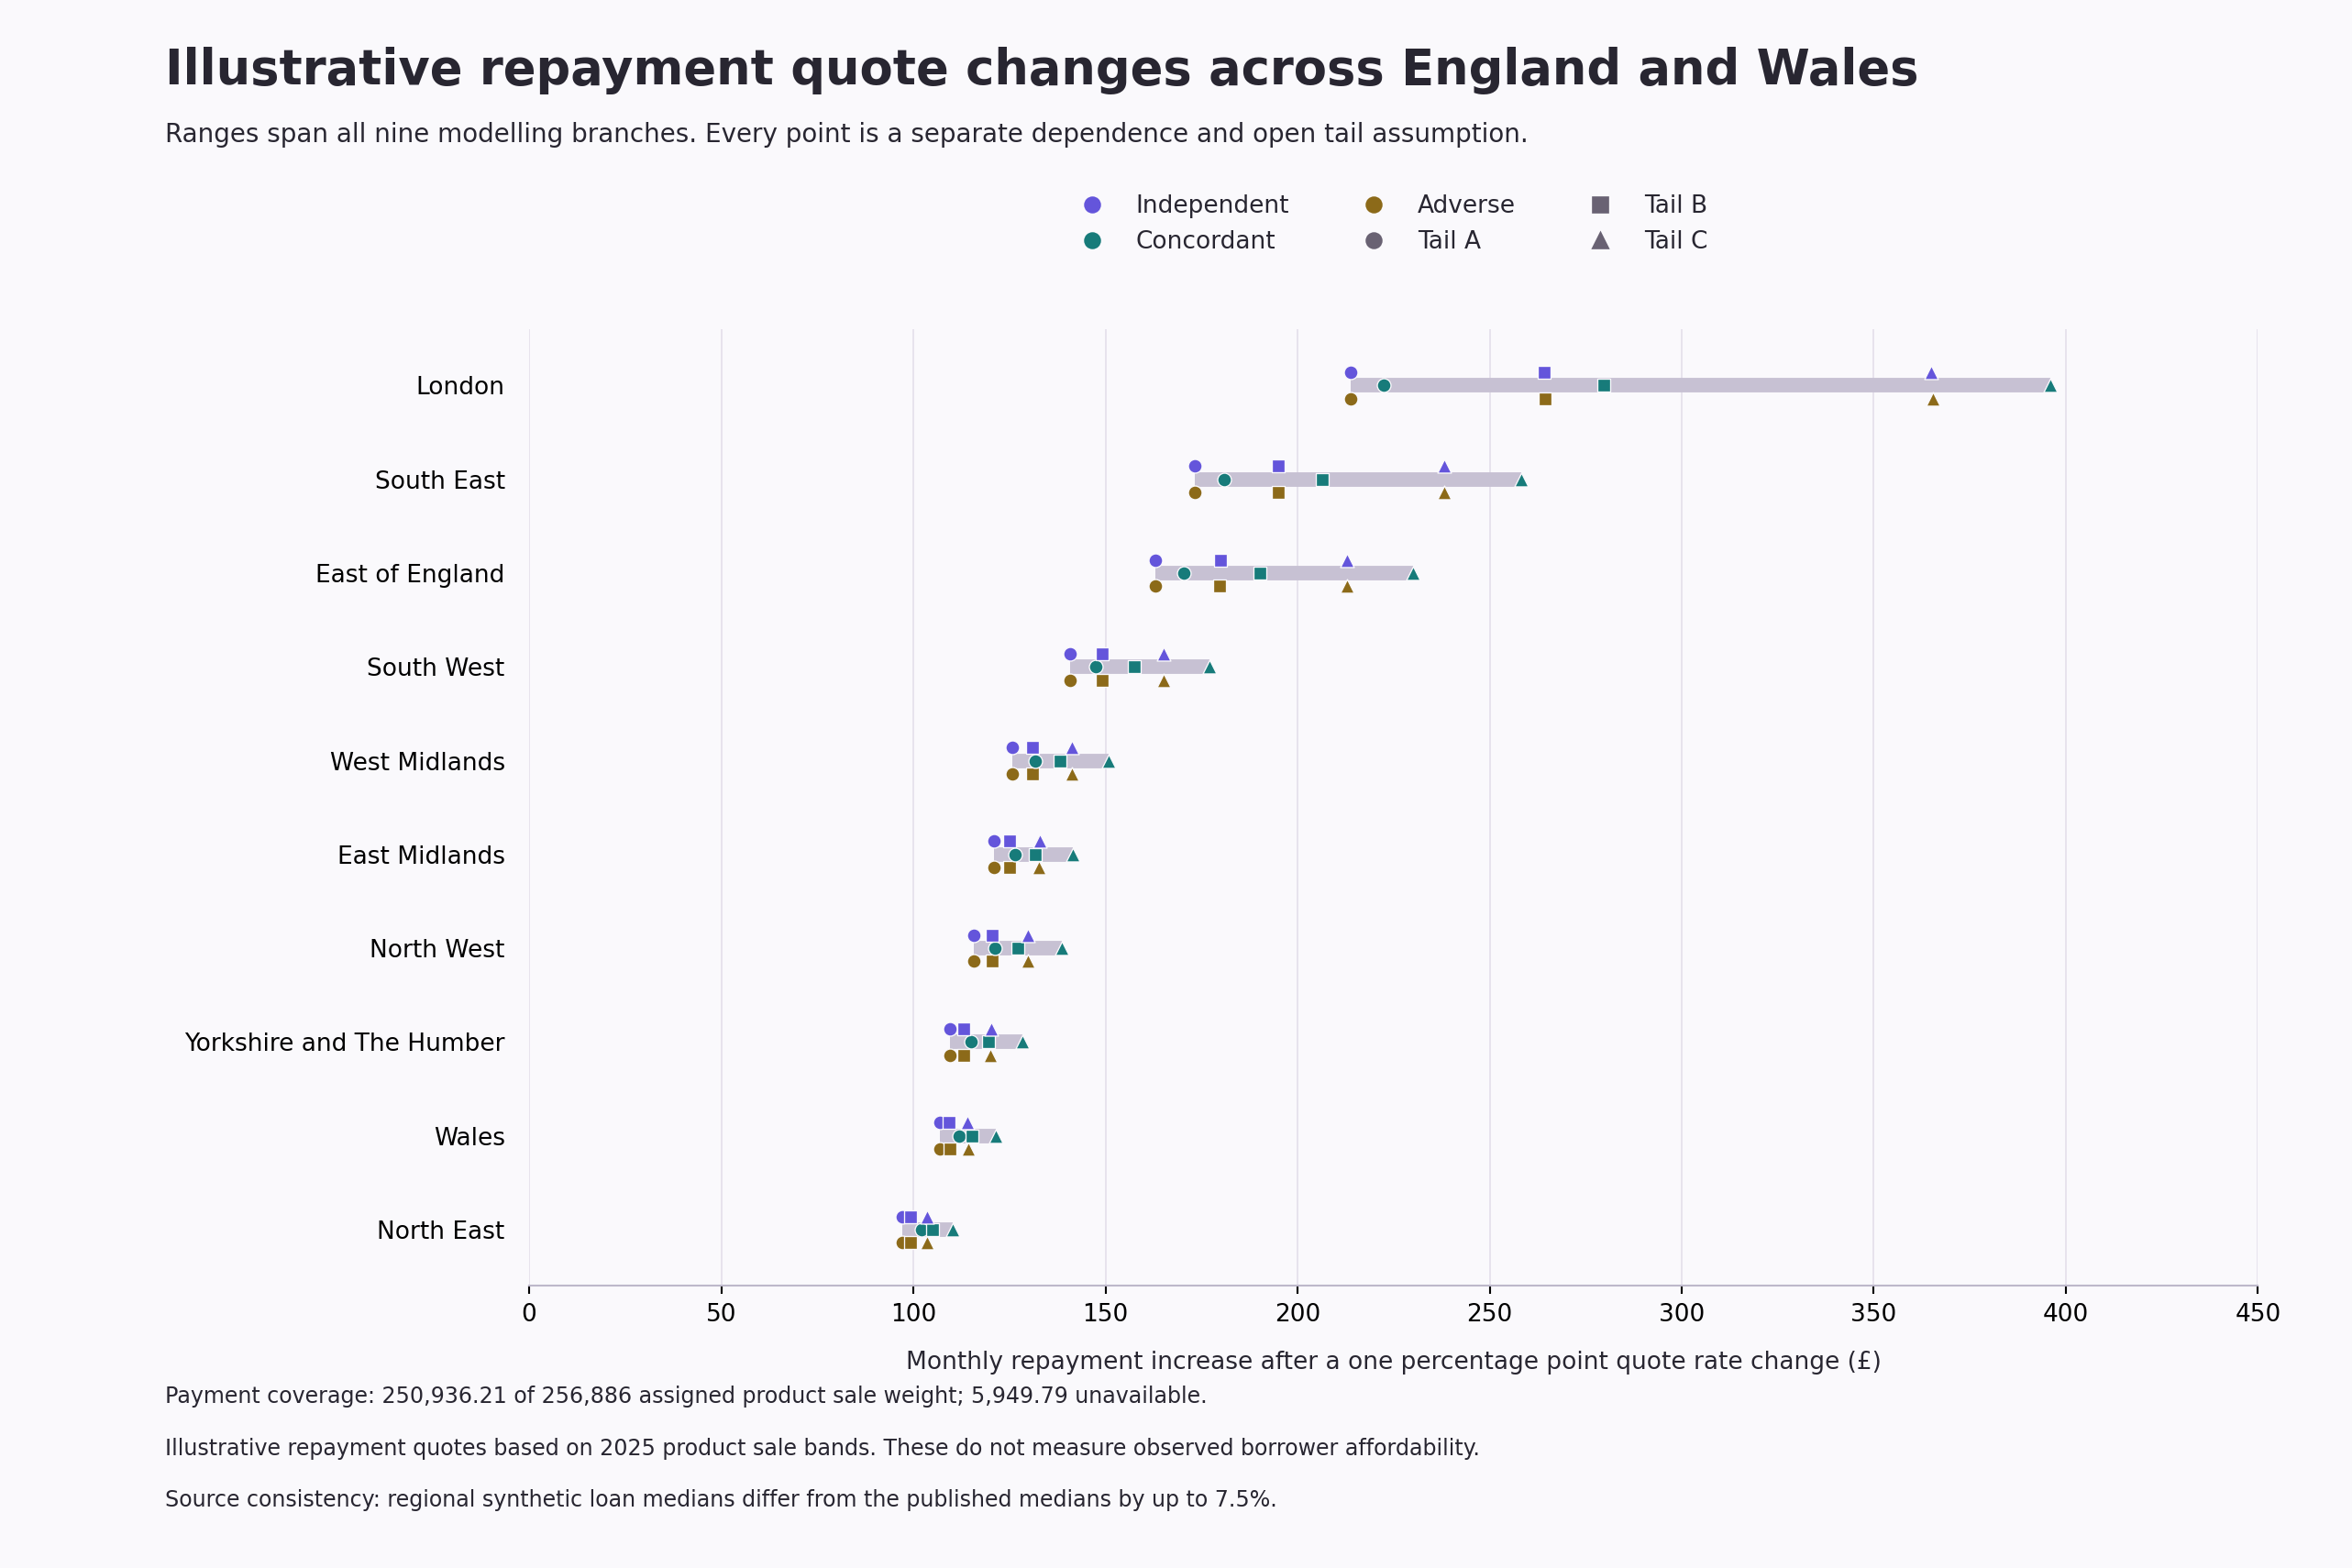
Conditional monthly repayment increases after a one percentage point rise in the quoted annual rate. The nine modelling branches remain separate; the ranges describe their sensitivity. View the full size chart or download the figures.
The source period is October to December 2025. The product sale release was first published on 20 August 2026 and the MLAR workbook on 8 September 2026; both retained captures were collected on 15 November 2026. We assign UK regulated gross advance mean rates from MLAR for the same quarter to fixed and variable rate quotes. This is a surrogate rate assignment between sources with different coverage.
The nine branches combine three ways of pairing loan amount, income and term with three choices for the upper ends of open bands. The pairings use independent draws, matching ranks, or higher loans paired with lower incomes while terms remain independent. Values within bands, the upper caps and repayment borrowing are assumptions. The published margins do not identify a joint financial distribution.
Each branch is weighted to the same published total of 256,886 product sales. The payment comparison covers 250,936.21 of that weight, leaving 5,949.79 unavailable. Both income measures use the same smaller population with positive assigned income and both payments available: 239,423.61 covered weight and 17,462.39 unavailable. Fractional weights describe the synthetic sample's representation of the source flow.
The weighted mean of individual ratios averages each quote's payment divided by its assigned monthly gross income. The ratio of totals instead divides weighted payment totals by weighted assigned monthly income totals. In independent Tail B, the baseline values are 150.68% and 26.65% respectively. They answer different questions about the same covered synthetic population.
Very small assigned incomes make the individual average sensitive to the assumed loan and income pairing. In independent Tail B, the common sample's lowest positive assigned annual income is £0.19. Assigned annual incomes below £100 contribute 36.19% of its baseline individual ratio sum. Those extreme ratios arise from the assumed draws within a broad income band; the published data do not establish those loan and income pairings.
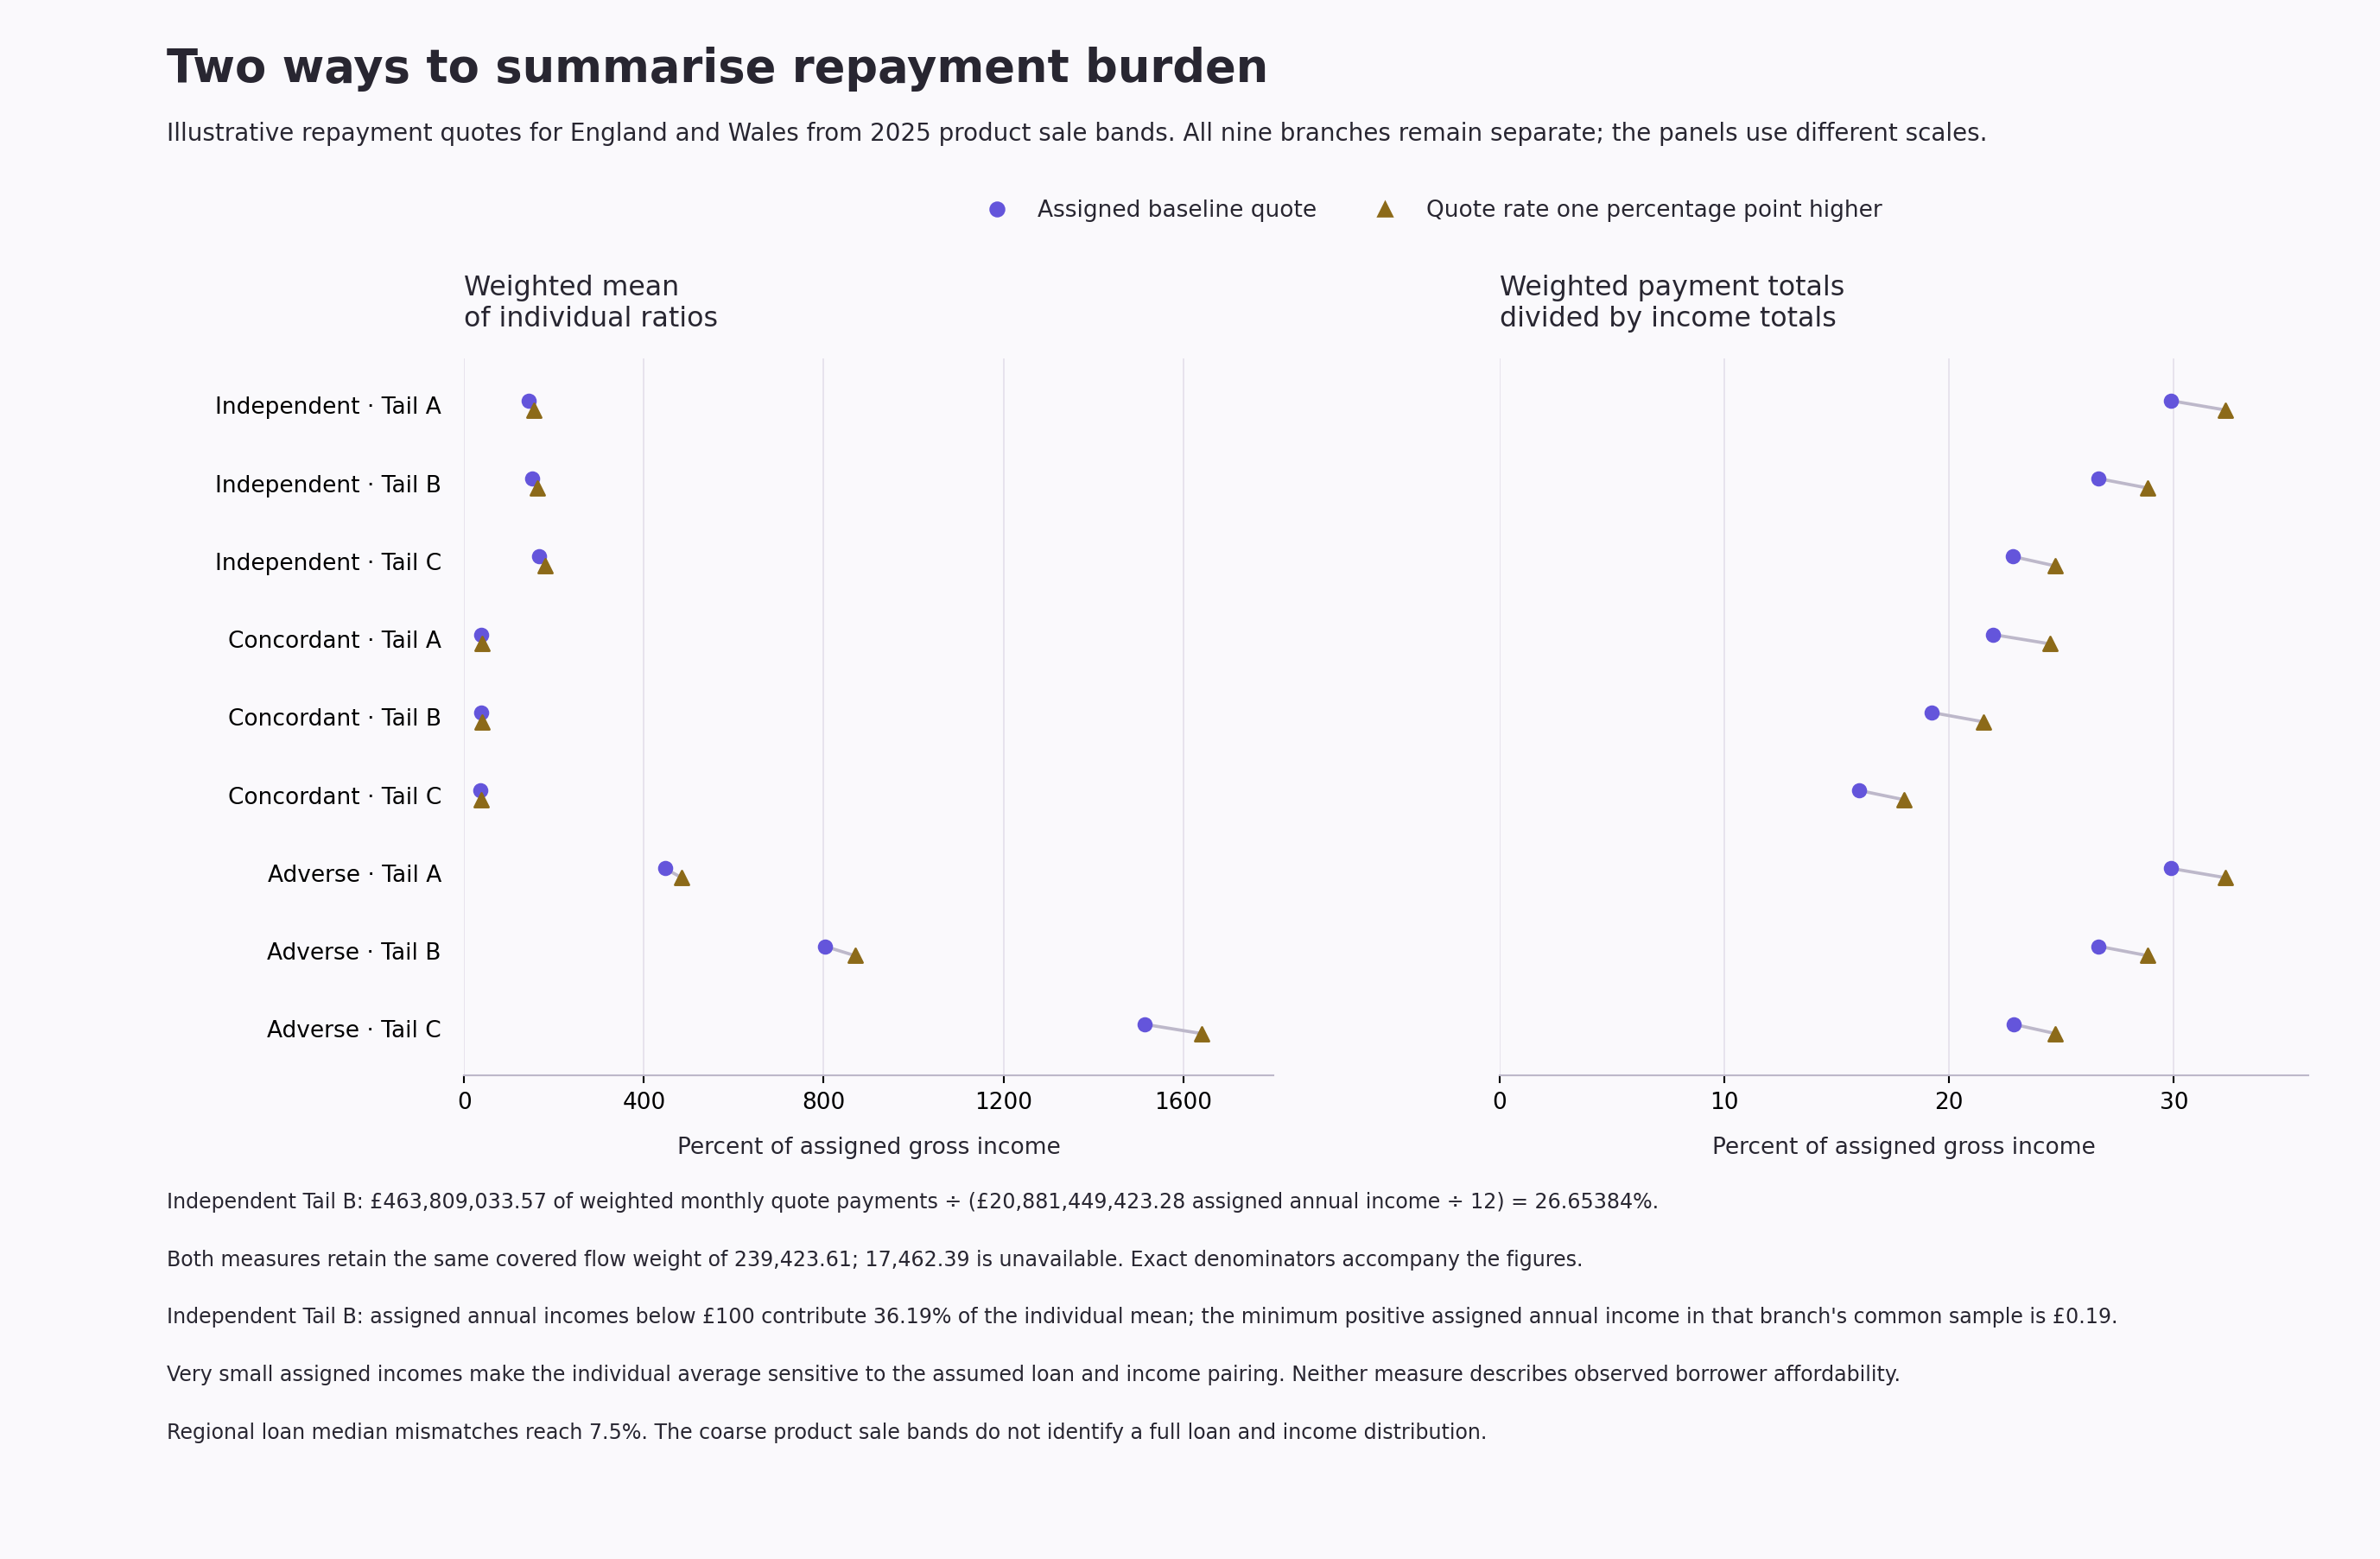
The mean of individual ratios and the ratio of payment and income totals use the same covered synthetic population and different scales. Very small assigned incomes make the individual mean sensitive to the assumed pairing. View the full size chart or download the figures.
What this release cannot prove
Synthetic regional principal medians differ from the same quarter's published medians by up to 7.5%. This consistency check limits what the assumed financial distribution can support. The separate branches describe sensitivity to the declared assumptions rather than a confidence interval.
The work ran on Isambard AI, using GPUs for the quote calculations and CPUs for qualification and aggregate analysis. Nine million synthetic states produced 72 million scenario evaluations across eight rate cases. The figures here compare the baseline with the one percentage point rise. These calculations are illustrative quotes, not observed household outcomes. The study measures a conditional arithmetic response and does not forecast actual borrower payments or house prices.
The regional repayment figures retain every branch with its covered and missing weight. The income measures keep the two definitions separate, including their payment numerators and assigned income denominators.
The income band contributions show which assigned incomes drive the individual averages. The principal median comparisons check synthetic loans against the FCA figures, while the branch definitions retain the within band and open tail assumptions. The file manifest records definitions, dates and exact file hashes.
Please cite Upgraded Intelligence when using these illustrative quote results. For research enquiries or corrections, contact hello@theupgradeauthority.co.uk.
Suggested citation
Upgraded Intelligence (2026), How higher mortgage quote rates change repayments, version 1.0, UI-MTG-QUOTE-2026-01.