Media & citations
Property evidence with its definitions and limits attached.
Press facts, charts and data are provided with the dates, definitions and limits needed to report them accurately.
Contact the research desk22published outputs
361local authorities in the Atlas
11comparable property measures
UKnational evidence releases
Latest market note
Published 4 October 2026
UK property market in October 2026
House price growth has slowed. Mortgage approvals and borrowing costs add a different view of the market, alongside the latest official rent and sale prices.
Press release
Published 22 September 2026
Upgraded Intelligence expands UK property evidence map to 464,656 current records
The 22 September release adds 97,874 mapped current record representations, improves national grid completion to 99.48% and keeps the distinction between evidence coverage and market growth explicit.
Latest evidence briefing
UI-BRF-2026-09-30 · Published 30 September 2026
UK Property Evidence Briefing
A UK wide account of evidence growth, comparable local authority movement, regional coverage and the quality limits that govern every published reading.
Local research case study
UI-MKT-BRI-2026-01 · Published 18 August 2026
Bristol Rental Market Report 2026
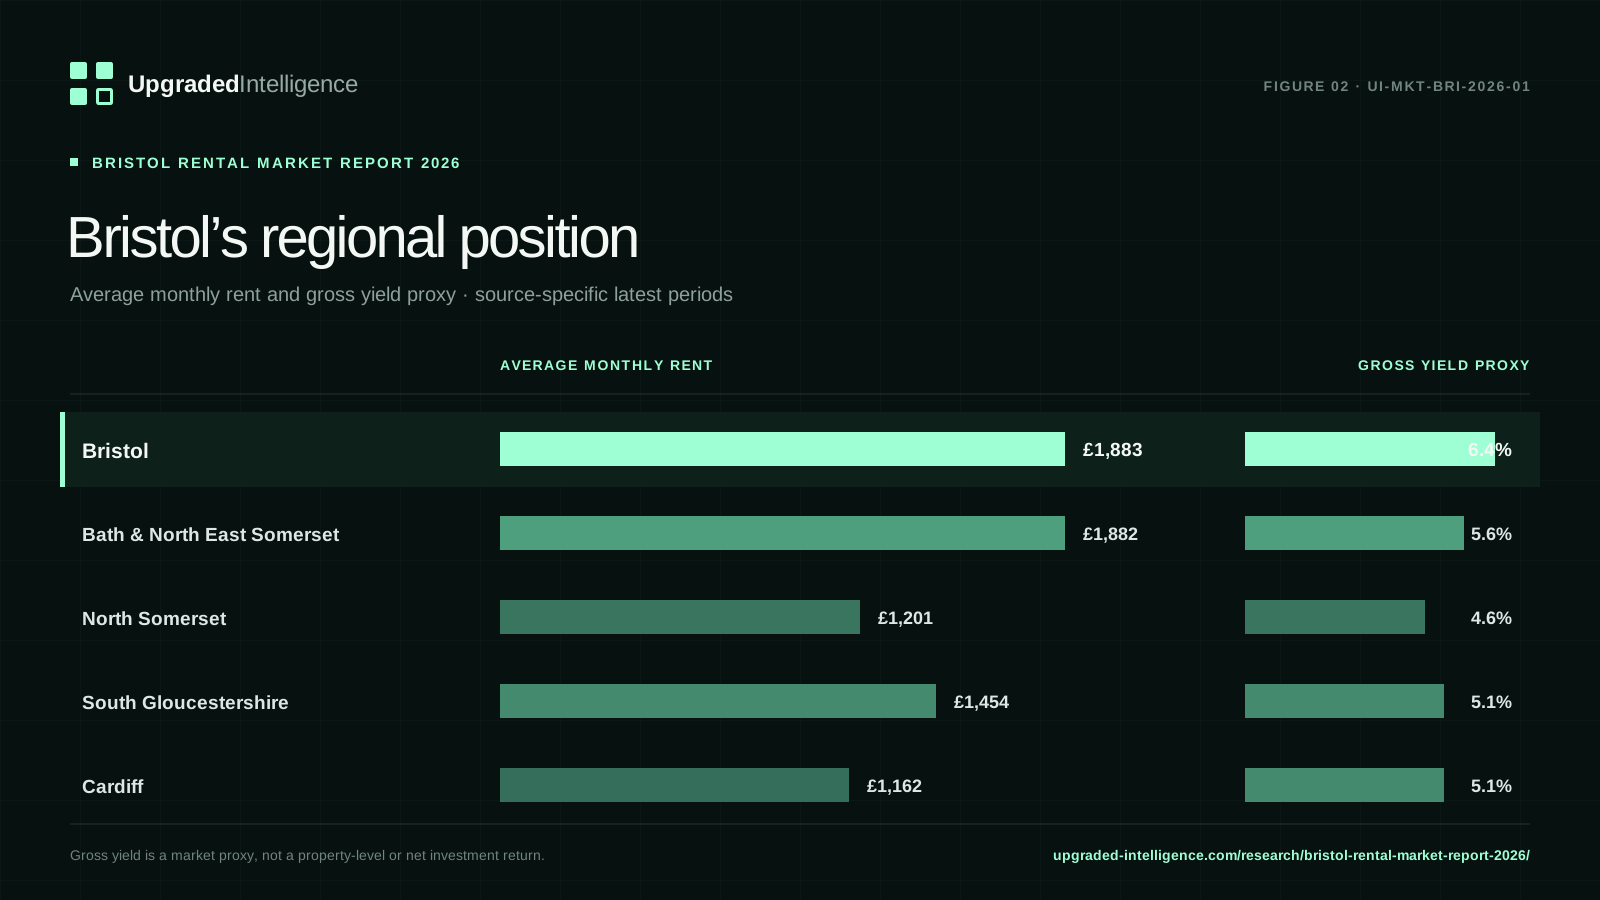
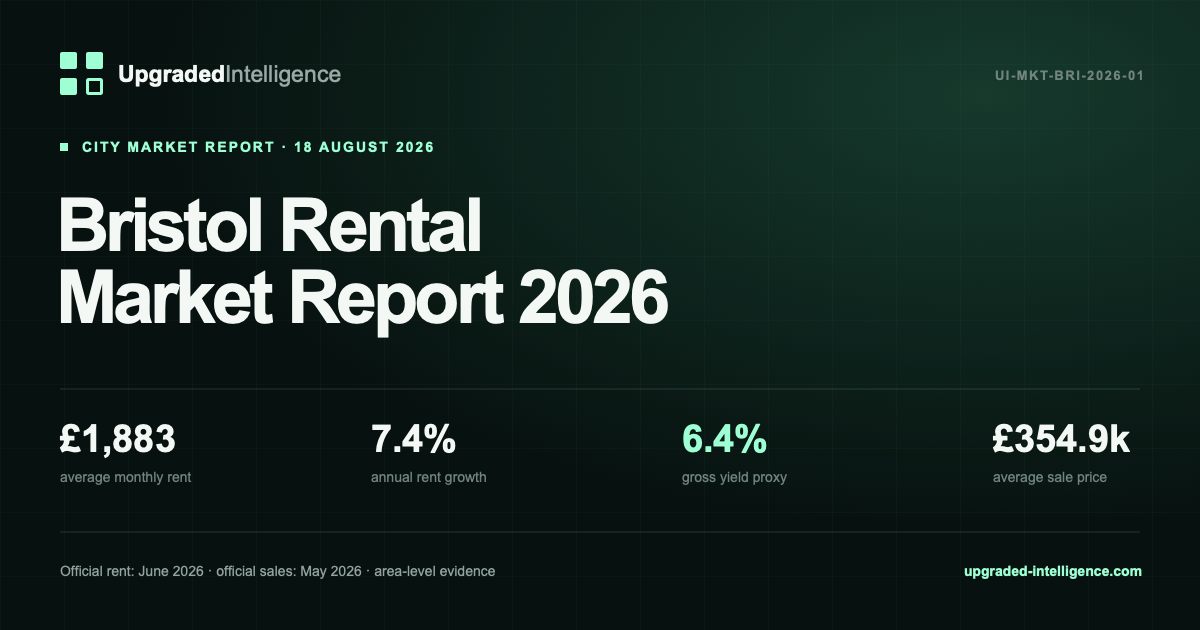
Bristol combines a high average monthly rent with rapid annual growth and a gross-yield proxy above the national median. The release joins official rent and sale-price series while keeping their evidence dates and analytical limits explicit.
Press coverage
The report in the property press.
Downloadable figures
Charts for accurate editorial use.
Use the files without modification, retain the visible credit and link to the full report. Source datasets remain subject to their publishers’ terms.
Reporting notes
What the figures do—and do not—say.
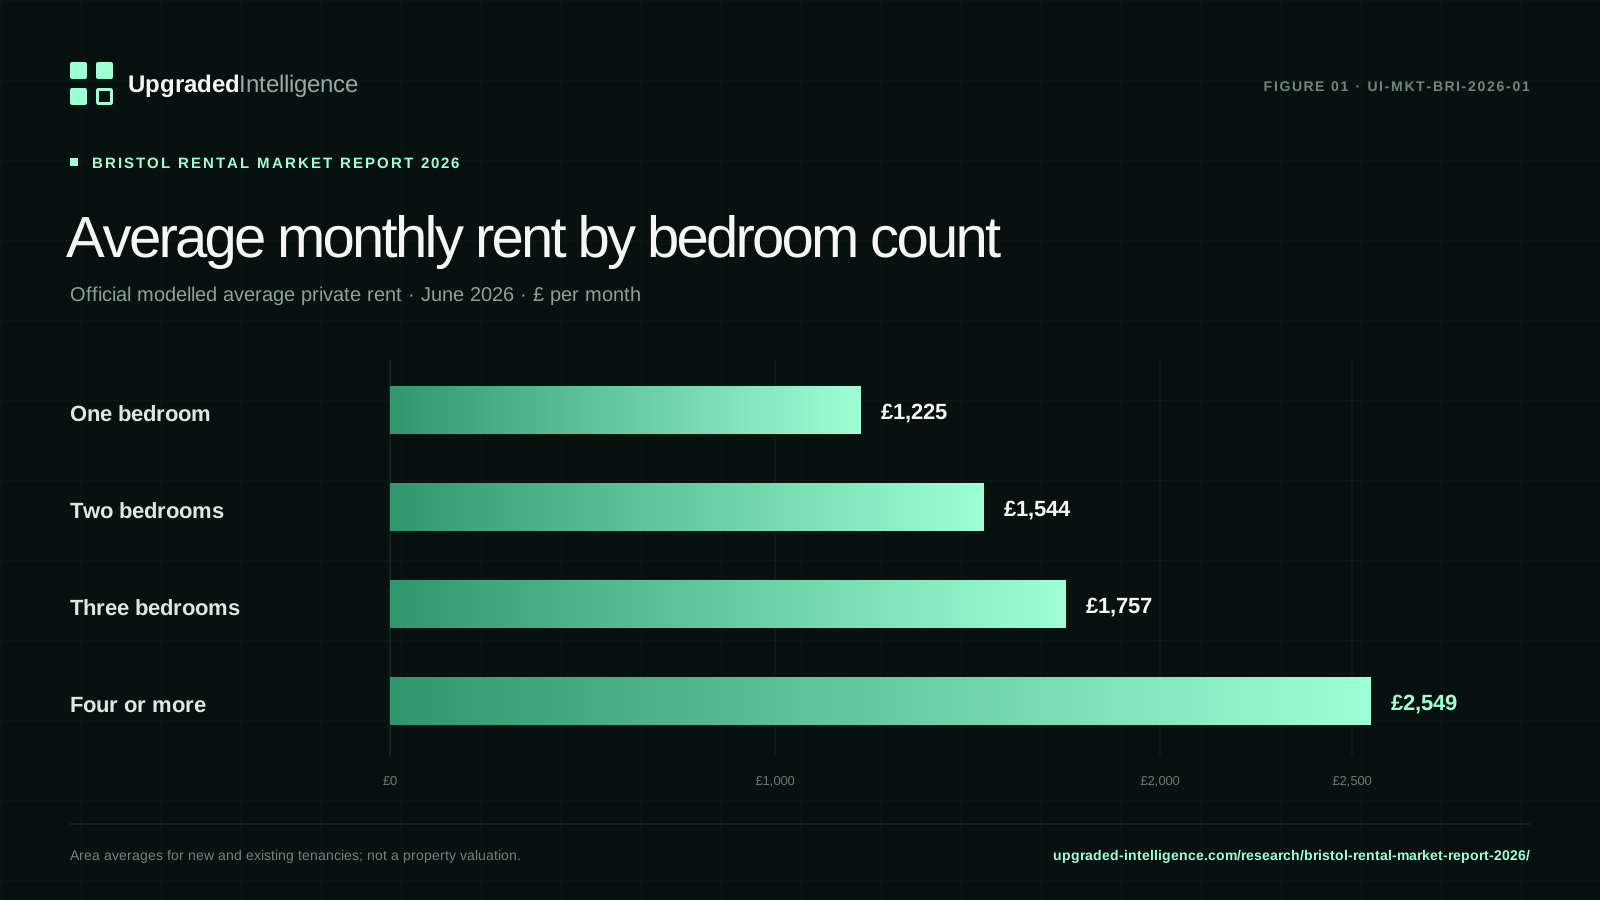
Rent is an area average. £1,883 is the official modelled average for new and existing private tenancies in Bristol, not an asking rent or a valuation for one home.
Yield is a comparison proxy. 6.4% is annualised average rent divided by average sale price. It excludes costs and does not represent a property-level investment return.
Evidence dates differ. Rents are from June 2026 and sale prices from May 2026. Every use should preserve those dates.
Short-stay observations are separate. They are aggregated market records, not unique homes, and cannot establish displacement or causality.
Citation and data
A stable reference for the release.
Suggested citation
Upgraded Intelligence (2026), Bristol Rental Market Report 2026, version 1.0, UI-MKT-BRI-2026-01.
- Data extract
- CSV · 25-month histories and comparators
- Corrections
- hello@theupgradeauthority.co.uk