How often do asking rents fall after a month?
Bottom line
Among 446 adverts we could compare 30 days apart, 160 had a lower asking rent, or 35.9%. The median monthly cut was £57.50. Comparable prices were available for 24.4% of the 1,827 starting adverts.
Upgraded Intelligence compared saved Rightmove residential rental search cards for the same adverts exactly 30 UTC calendar days apart. Of 446 adverts with usable monthly prices on both dates, 160 were cheaper at the second check, or 35.9%.
Among those 160 cuts, the median monthly reduction was £57.50. The median individual percentage reduction was 4.55%, calculated against each advert’s own starting price. The asking rent cuts explorer has the latest edition. The figures and charts in this report are from the original October sample.
Cuts were more common among three bedroom adverts
Lower asking rents appeared in 38 of the 82 matched three bedroom adverts, or 46.3%. Their median monthly cut was £85. Among two bedroom adverts, 63 of 147 had a lower price, or 42.9%, with a median cut of £65. One bedroom adverts recorded 39 cuts among 110 comparisons, or 35.5%, with a median cut of £50.
Adverts with four or more bedrooms showed a different pattern. Fifteen of 77 had a lower price, or 19.5%, but their median monthly cut was £100. Studios recorded three cuts among 27 comparisons. The published groups need at least five reductions before a median is shown.
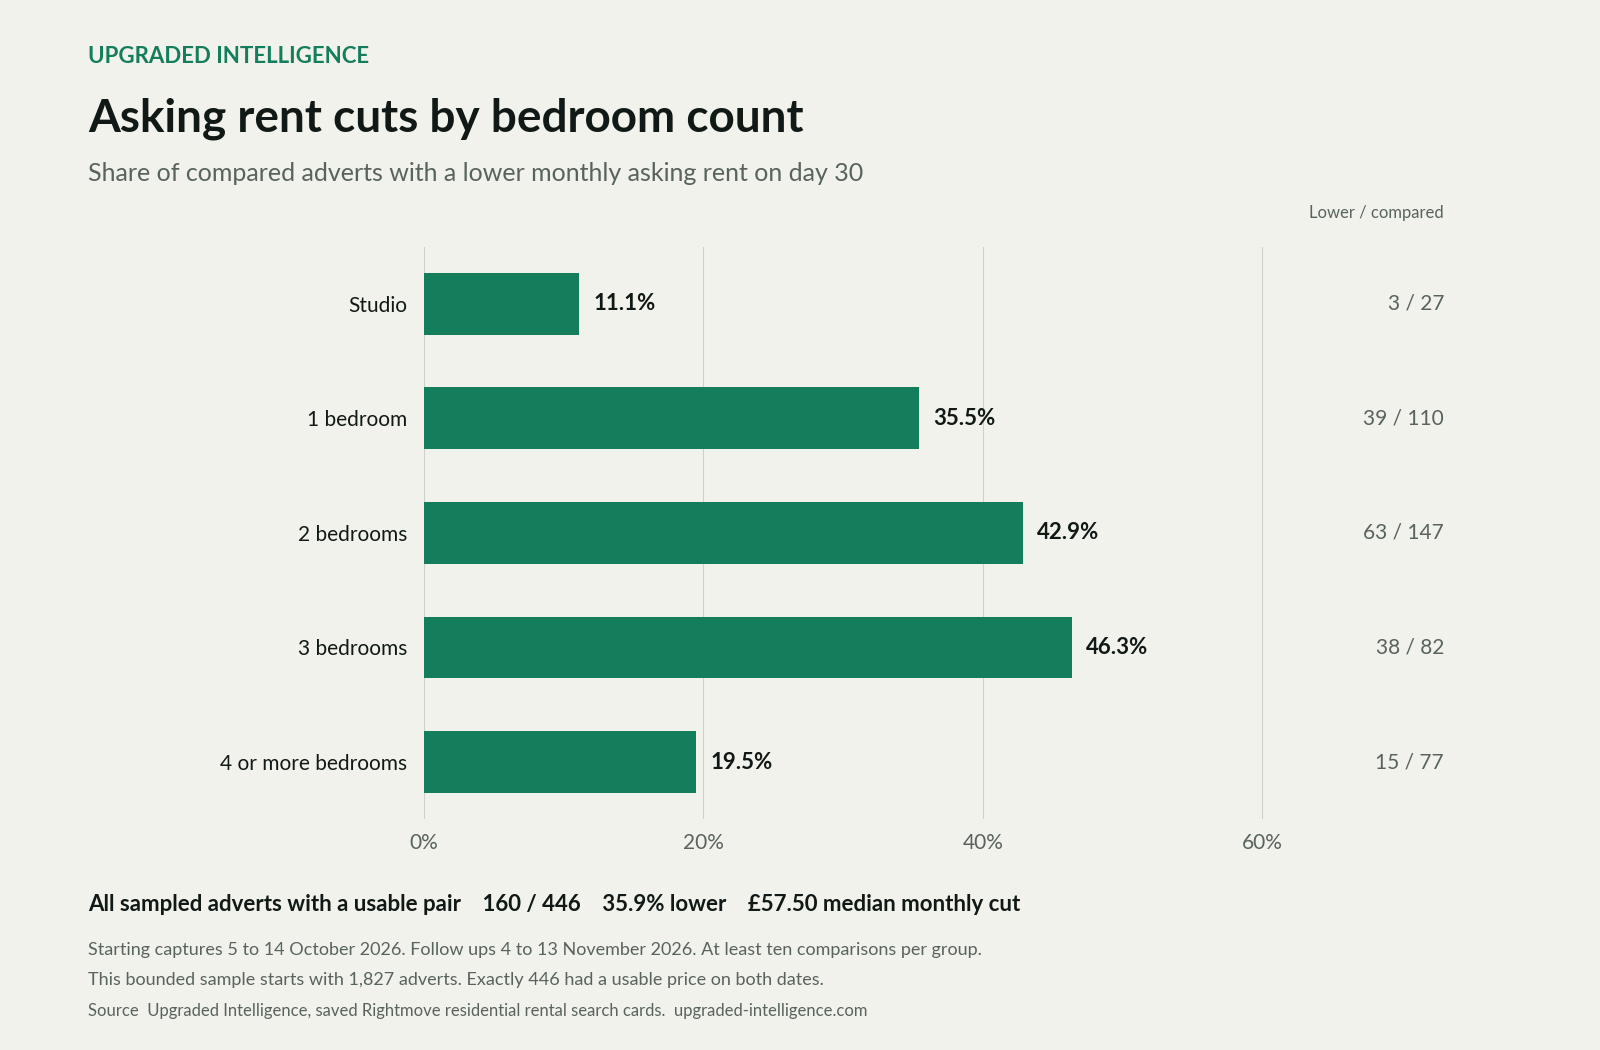
The bedroom chart compares each published group with its own matched adverts. Median reductions describe the adverts whose asking rent fell.
London had a larger cash reduction
London supplied the largest published regional comparison, with 118 matched adverts from 442 starting adverts. Forty seven had lower asking rents, or 39.8%, and their median monthly reduction was £100. In the South East, 32 of 77 matched adverts recorded cuts, or 41.6%, with a median reduction of £50.
The East Midlands recorded 15 cuts among 34 matched adverts, or 44.1%, with a median monthly reduction of £50. The South West recorded ten among 31, or 32.3%, also with a £50 median. These groups contain different mixes of homes and asking prices, and their coverage varies.
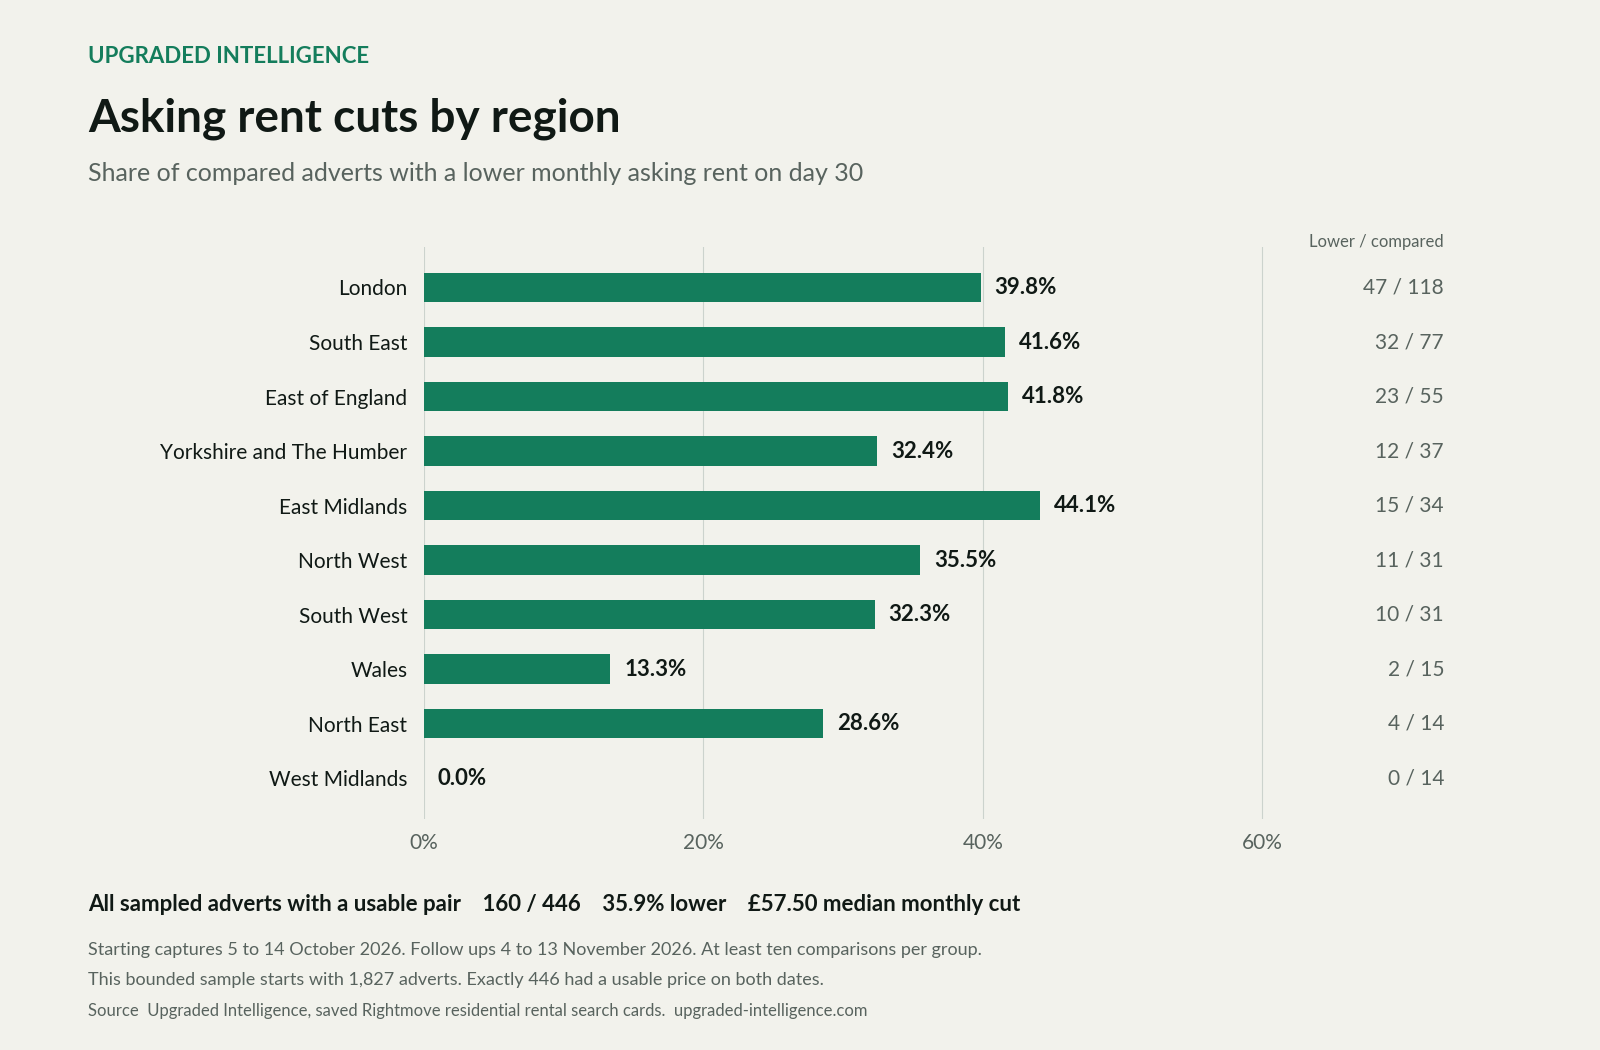
The regional chart shows the number of usable comparisons beside each result. The explorer also includes eight local authority samples. Each has between ten and 19 matched adverts, so individual adverts can move those local percentages substantially.
What happened to the other starting adverts?
The starting sample contained 1,827 adverts first recorded from 5 to 14 October 2026. Prices could be compared for 446 of them, or 24.4%. Another 1,338 had no saved search card on day 30, and 43 had a day 30 capture without a comparable price. The 35.9% cut figure uses the 446 usable pairs as its denominator.
Those gaps matter. Adverts with a usable price a month later may differ from adverts absent from the saved cards. The missing captures leave their later asking prices and letting outcomes unknown.
How we made the comparison
The starting date is the day we first recorded an advert. The sample checks up to 500 recent candidate captures in each six hour UTC window. For each advert, the comparison uses the last saved search card on that starting day and the last on day 30. Follow up dates ran from 4 to 13 November 2026. Both endpoints need a monthly asking price in pounds.
A group needs at least ten usable price pairs to appear, and at least five lower prices for its median reduction to be published. Area and bedroom results describe their own qualifying samples. These observations measure changes in advertised rents between the two checks. They leave the advert’s original listing date, intervening changes and eventual agreed rent unknown.
Download the figures as CSV or download the dated evidence as JSON. The methods page explains the 30 day comparison. Download the regional chart or bedroom chart for the published comparisons.
Interpretation boundary
What this release cannot prove
Usable day 30 price pairs cover 24.4% of the starting adverts. Results describe those observed pairs, with varying coverage and property mix across groups. The starting date is the first recorded date. The captures leave the original listing date, changes between the two endpoints, agreed rent and letting outcome unknown. Published groups need ten usable pairs. Median reductions need five lower prices and describe only adverts whose asking rent fell.
Publication record
How to cite this publication
Upgraded Intelligence (2026), How often do asking rents fall after a month?, version 1.0, UI-EDT-0T5CKXA.
Questions, corrections or requests for an accessible extract can be sent to hello@theupgradeauthority.co.uk.