Which private rentals reached EPC C?
Bottom line
Among homes recorded as privately rented on both certificates and starting at EPC D, 52.8% of flats and maisonettes reached C or above, compared with 44.0% of houses. Overall, 159,187 of the 250,017 homes that started below C were still below it at their latest assessment.
Upgraded Intelligence compared the first and latest usable Energy Performance Certificates for 331,882 homes in England and Wales recorded as privately rented on both assessment dates. Of the 250,017 that started below C, 90,830 (36.3%) reached C or above at their latest assessment. The other 159,187 (63.7%) stayed below C. Among the 81,865 homes that began at C or above, 12,187 moved below C and 69,678 stayed at C or above.
Starting grade makes a difference
Of 139,126 homes that started at D, 66,116 reached C or above (47.5%). The share was 27.4% for homes starting at E, 13.9% for F and 15.3% for G. Homes starting at D and E had a median of about ten years between certificates. For F and G the median was closer to four and a half years, giving those groups a different observation window.
Flats and houses that started at D
Among homes starting at D, 31,732 of 60,123 flats and maisonettes reached C or above (52.8%), compared with 32,840 of 74,625 houses (44.0%). The median gap between certificates was ten years for both. The latest certificate supplies the property type. Differences in the age, location and condition of the homes can influence the comparison.
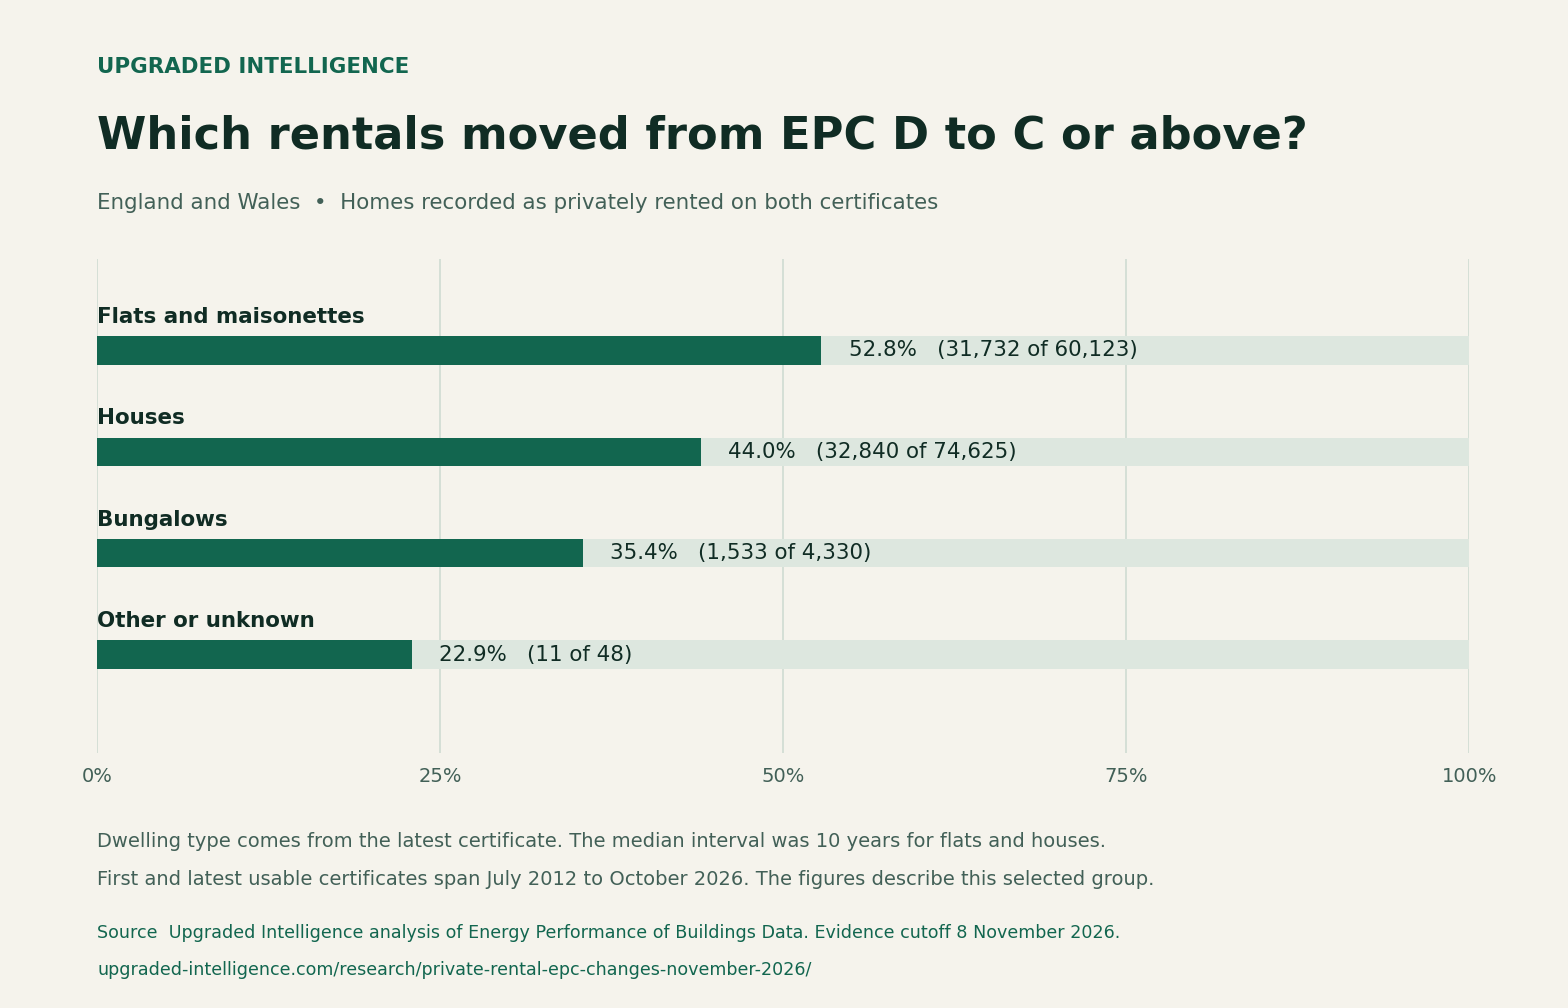
Download the chart (PNG) · Download the figures (CSV) · Explore private rentals in Energy Changes.
How we matched the certificates
We matched domestic certificates using the property reference, selected the earliest and latest usable grades on different dates, and excluded properties with conflicting grades on a single date. We then required all usable records on both selected dates to record private rental tenure. The first and latest dates in this group span 3 July 2012 to 31 October 2026. Only 38.27% of homes in the wider repeat assessment analysis had a known tenure at both dates. The CSV includes the four movements around C, each starting band below C and property types for homes starting at D.
Source data comes from Energy Performance of Buildings Data, with the evidence cutoff on 8 November 2026. Contains public sector information licensed under the Open Government Licence v3.0. The wider sample is described in Recorded home energy improvements.
Interpretation boundary
What this release cannot prove
The findings describe selected homes with repeated assessments and private rental tenure recorded at both endpoints. They cannot establish a rate for the whole private rented sector or continuous or current rental tenure. Assessment intervals vary. The comparison cannot identify the work carried out, attribute the grade change to a cause or establish current compliance.
Publication record
How to cite this publication
Upgraded Intelligence (2026), Which private rentals reached EPC C?, version 1.0, UI-EDT-1EDHYGC.
Questions, corrections or requests for an accessible extract can be sent to hello@theupgradeauthority.co.uk.